participant_demographics#

You can see the full contents of this project on GitHub.

participant_demographics#

Annotating information about participants: count, sex, age, and diagnosis.

Papers#

How the papers were obtained#

Typically with pubget. We recommend invoking pubget with the --query_file option, and storing a copy of the query file in the project’s directory, or including a copy in the README.md.

<description>

Where the full papers are stored#

The full pubget output can be found here on OSF: https://osf.io/kfmdp/

Annotations#

File(s) being annotated:#

  • /projects/<project_name>/documents/<documents_file1_name>.jsonl

    • corresponding file in the pubget output:

      • <pubget_folder_name>/subset_allArticles_labelbuddyData/<documents_file1_name>.jsonl

  • /projects/<project_name>/documents/<documents_file2_name>.jsonl

    • corresponding file in the pubget output:

      • <pubget_folder_name>/subset_allArticles_labelbuddyData/<documents_file2_name>.jsonl

Annotation labels:#

  • <label1>: <description of label1>

  • <label2>: <description of label2>

Labels found in other projects as well:#

  • <label2>

Instructions for annotators#

<description>

Some analyses of this project’s annotations are shown in this page.

How to annotate#

Annotating demographic information about the participants is more complex than other projects in this repository, because studies typically involve several groups of participants, with diverse structures, and there is some variation in how the relevant information is reported. To annotate a piece of information about a group of participants, we stack several annotations on top of each other. We add annotations that identify the group of participants (eg patients vs controls), then an annotation that contains the information of interest (eg count, min age, etc.). To be easily linked these annotations should be at the exact same positions, which is easy to acheive in labelbuddy by clicking several labels in sequence (or by first selecting an existing annotation and then clicking a new label to add it on top).

We consider that most articles roughly conform to the participant group structure depicted in the tree shown in Fig. 1. The root contains all the participants, which are then divided in patients and healthy controls, each of which may contain several subgroups, and finally each subgroup can contain females and males. Note that for many articles, some of the nodes will be empty – eg studies involving only healthy controls, only one sex, etc.

../_images/annotate_participants.png

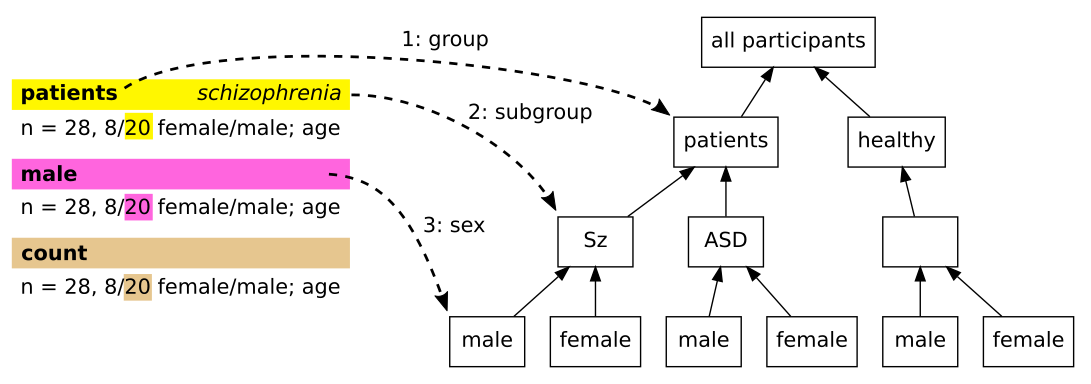
Fig. 1 The participant group structure and corresponding annotations.#

Annotation example with subgroups#

In Fig. 1 we see the general way of annotating information about participants. We start by describing the most complex case but for most annotations the situation will be simpler.

This video (without sound) illustrates the annotation process that is described below. The report on the left shows a continuously updated summary of the participants in the current document, it is launched with the scripts/watch_participants.py script as explained here.

Here we annotate the count (20) of a specific subgroup, constituted of:

  • Patients

  • Within patients, the schizophrenia subgroup (this article also has an autism spectrum disorder subgroup of patients)

  • Within the schizophrenia subgroup, the males.

To annotate this information, we select the information we want to annotate and then apply labels, starting from the top of the participants tree (the actual order doesn’t matter, this is just a suggestion). We first click the “patients” label.

Then, as there are several patients subgroups in this article, we need to differentiate the schizophrenia subgroup. We don’t want to add new labels for subgroups, as we would end up with a very long list of labels, most of which are used in few papers (eg “schizophrenia”, “siblings”, “experts”, etc.) Instead, we rely on the extra data input field in labelbuddy. While the “patients” annotation is still selected, we write int its extra data field (on the bottom left of labelbuddy). We enter in there whatever name we want to give to the schizophrenia subgroup, which will act as a local identifier within the current paper. This name is arbitrary and only serves to link the different annotations about that subgroup, here we unoriginally chose “schizophrenia”. Referring it to it again for other annotations will be easy because labelbuddy will propose it in a completion list whenever we are entering extra data for the “patients” label.

Next, we click on the “males” label to create a new annotation, indicating that within the “patients” / “schizophrenia” subgroup, we are looking at the males. Finally, we click on the “count” label to create a new annotation, indicating the type of information contained in our selected text. If needed, we can use the extra data here again – for example if the count was indicated as “twenty” (in English), we would enter in the extra data “20” (the value in numbers), to make it easier to use the annotation later.

So to summarize, the steps are:

  • Select the group (“patients” or “healthy”)

  • Enter the subgroup identifier in the “extra data” field (with the help of the completion list if we have seen that subgroup before)

  • Select the sex (“females” or “males”)

  • Select the label that indicates the type of information (“count”, “age mean”, etc.)

  • If necessary add any complementary information in the “extra data” field (eg “20” when the selected text is “twenty”).

When we annotate information about nodes that are higher in the participant group tree, we simply omit the labels that do not apply. For example, if we are annotating the total count of participants (healthy and patients), we simply apply the label “count”, without indicating a group, subgroup or sex. As we see below, when we select the diagnosis, we only indicate the group and subgroup, as the diagnosis applies to both males and females.

Here are all the annotations for article discussed above, PMC8883821:

PMC8883821

See article on PMC

Labelled by Jerome_Dockes in participant_demographics

Disease-Specific Contribution of Pulvinar Dysfunction to Impaired Emotion Recognition in Schizophrenia

78 participants

Healthy participants

30 participants, 8 females, 22 males

Age range: 19 54 years

Patients   autism spectrum disorder

Diagnosis: autism spectrum disorder

20 patients, 4 females, 16 males

Age range: 19 43 years

Patients   schizophrenia

Diagnosis: schizophrenia

28 patients, 8 females, 20 males

Age range: 21 54 years

full extraction details
count = 78, age minimum = 19, age maximum = 54

patients

count = 48, age minimum = 19, age maximum = 54

schizophrenia

count = 28, age minimum = 21, age maximum = 54, diagnosis = schizophrenia

female

count = 8, age minimum = 21, age maximum = 54, diagnosis = schizophrenia

male

count = 20, age minimum = 21, age maximum = 54, diagnosis = schizophrenia

autism spectrum disorder

count = 20, diagnosis = autism spectrum disorder, age minimum = 19, age maximum = 43

female

count = 4, age minimum = 19, age maximum = 43, diagnosis = autism spectrum disorder

male

count = 16, age minimum = 19, age maximum = 43, diagnosis = autism spectrum disorder

healthy

count = 30, age minimum = 19, age maximum = 54

_

count = 30, age minimum = 19, age maximum = 54

female

count = 8, age minimum = 19, age maximum = 54

male

count = 22, age minimum = 19, age maximum = 54
patients
schizophrenia
female
count
…of several neuropsychiatric disorders including schizophrenia (Sz) and autism spectrum disorders (ASD). Here, we investigated potential visual sensory contributions to FER deficits in Sz ( n = 28, 8 /20 female/male; age 21–54 years) and adult ASD ( n = 20, 4/16 female/male; age 19–43 years) participants compared to neurotypical ( n = 30, 8/22 female/male; age 19–54 years) controls using tas…
patients
schizophrenia
male
count
… several neuropsychiatric disorders including schizophrenia (Sz) and autism spectrum disorders (ASD). Here, we investigated potential visual sensory contributions to FER deficits in Sz ( n = 28, 8/ 20 female/male; age 21–54 years) and adult ASD ( n = 20, 4/16 female/male; age 19–43 years) participants compared to neurotypical ( n = 30, 8/22 female/male; age 19–54 years) controls using task-b…
patients
autism spectrum disorder
female
count
…(Sz) and autism spectrum disorders (ASD). Here, we investigated potential visual sensory contributions to FER deficits in Sz ( n = 28, 8/20 female/male; age 21–54 years) and adult ASD ( n = 20, 4 /16 female/male; age 19–43 years) participants compared to neurotypical ( n = 30, 8/22 female/male; age 19–54 years) controls using task-based fMRI during an implicit static/dynamic FER task. Compa…
patients
autism spectrum disorder
male
count
…z) and autism spectrum disorders (ASD). Here, we investigated potential visual sensory contributions to FER deficits in Sz ( n = 28, 8/20 female/male; age 21–54 years) and adult ASD ( n = 20, 4/ 16 female/male; age 19–43 years) participants compared to neurotypical ( n = 30, 8/22 female/male; age 19–54 years) controls using task-based fMRI during an implicit static/dynamic FER task. Compared…
healthy
female
count
…ry contributions to FER deficits in Sz ( n = 28, 8/20 female/male; age 21–54 years) and adult ASD ( n = 20, 4/16 female/male; age 19–43 years) participants compared to neurotypical ( n = 30, 8 /22 female/male; age 19–54 years) controls using task-based fMRI during an implicit static/dynamic FER task. Compared to neurotypical controls, both Sz ( d = 1.97) and ASD ( d = 1.13) participan…
healthy
male
count
… contributions to FER deficits in Sz ( n = 28, 8/20 female/male; age 21–54 years) and adult ASD ( n = 20, 4/16 female/male; age 19–43 years) participants compared to neurotypical ( n = 30, 8/ 22 female/male; age 19–54 years) controls using task-based fMRI during an implicit static/dynamic FER task. Compared to neurotypical controls, both Sz ( d = 1.97) and ASD ( d = 1.13) participants …
patients
schizophrenia
count
…ophysiological mechanisms underlying social cognitive impairments in neuropsychiatric populations. ## Materials and Methods ### Participants Seventy-eight participants took part, including 28 participants (age range 21–54 years) diagnosed with schizophrenia (Sz) using the Structured Clinical Interview for DSM-IV ( ), 20 adults with autism spectrum disorder (ASD) (age range 19–43 years), c…
patients
schizophrenia
age minimum
…nderlying social cognitive impairments in neuropsychiatric populations. ## Materials and Methods ### Participants Seventy-eight participants took part, including 28 participants (age range 21 –54 years) diagnosed with schizophrenia (Sz) using the Structured Clinical Interview for DSM-IV ( ), 20 adults with autism spectrum disorder (ASD) (age range 19–43 years), confirmed by the Autism Diag…
patients
schizophrenia
age maximum
…rlying social cognitive impairments in neuropsychiatric populations. ## Materials and Methods ### Participants Seventy-eight participants took part, including 28 participants (age range 21– 54 years) diagnosed with schizophrenia (Sz) using the Structured Clinical Interview for DSM-IV ( ), 20 adults with autism spectrum disorder (ASD) (age range 19–43 years), confirmed by the Autism Diagnos…
patients
schizophrenia
diagnosis
…mpairments in neuropsychiatric populations. ## Materials and Methods ### Participants Seventy-eight participants took part, including 28 participants (age range 21–54 years) diagnosed with schizophrenia (Sz) using the Structured Clinical Interview for DSM-IV ( ), 20 adults with autism spectrum disorder (ASD) (age range 19–43 years), confirmed by the Autism Diagnostic Observation Schedule, Second Edi…
patients
autism spectrum disorder
count
… ### Participants Seventy-eight participants took part, including 28 participants (age range 21–54 years) diagnosed with schizophrenia (Sz) using the Structured Clinical Interview for DSM-IV ( ), 20 adults with autism spectrum disorder (ASD) (age range 19–43 years), confirmed by the Autism Diagnostic Observation Schedule, Second Edition, and 30 neurotypical controls (age range 19–54 years) ( ). …
patients
autism spectrum disorder
diagnosis
…ts Seventy-eight participants took part, including 28 participants (age range 21–54 years) diagnosed with schizophrenia (Sz) using the Structured Clinical Interview for DSM-IV ( ), 20 adults with autism spectrum disorder (ASD) (age range 19–43 years), confirmed by the Autism Diagnostic Observation Schedule, Second Edition, and 30 neurotypical controls (age range 19–54 years) ( ). All Sz participants were on a stable …
patients
autism spectrum disorder
age minimum
…t, including 28 participants (age range 21–54 years) diagnosed with schizophrenia (Sz) using the Structured Clinical Interview for DSM-IV ( ), 20 adults with autism spectrum disorder (ASD) (age range 19 –43 years), confirmed by the Autism Diagnostic Observation Schedule, Second Edition, and 30 neurotypical controls (age range 19–54 years) ( ). All Sz participants were on a stable dose of antipsychoti…
patients
autism spectrum disorder
age maximum
…including 28 participants (age range 21–54 years) diagnosed with schizophrenia (Sz) using the Structured Clinical Interview for DSM-IV ( ), 20 adults with autism spectrum disorder (ASD) (age range 19– 43 years), confirmed by the Autism Diagnostic Observation Schedule, Second Edition, and 30 neurotypical controls (age range 19–54 years) ( ). All Sz participants were on a stable dose of antipsychotic m…
healthy
count
…g the Structured Clinical Interview for DSM-IV ( ), 20 adults with autism spectrum disorder (ASD) (age range 19–43 years), confirmed by the Autism Diagnostic Observation Schedule, Second Edition, and 30 neurotypical controls (age range 19–54 years) ( ). All Sz participants were on a stable dose of antipsychotic medication. All participants had at least 20/22 corrected visual acuity on a Logarithmic …
healthy
age minimum
…for DSM-IV ( ), 20 adults with autism spectrum disorder (ASD) (age range 19–43 years), confirmed by the Autism Diagnostic Observation Schedule, Second Edition, and 30 neurotypical controls (age range 19 –54 years) ( ). All Sz participants were on a stable dose of antipsychotic medication. All participants had at least 20/22 corrected visual acuity on a Logarithmic Visual Acuity Chart. On average, Sz …
healthy
age maximum
… DSM-IV ( ), 20 adults with autism spectrum disorder (ASD) (age range 19–43 years), confirmed by the Autism Diagnostic Observation Schedule, Second Edition, and 30 neurotypical controls (age range 19– 54 years) ( ). All Sz participants were on a stable dose of antipsychotic medication. All participants had at least 20/22 corrected visual acuity on a Logarithmic Visual Acuity Chart. On average, Sz par…

A simpler example#

When the participant structure of an article is simpler, we can omit any of the labels as long as it does not introduce an ambiguity. For example, if there is only one group of patients, we do not need to indicate a subgroup. If the study contains only patients or only healthy participants, we do not need to use the patients or healthy labels. Which label applies will be inferred from the presence of a diagnosis. The live report can help check that any information we leave out is being correctly inferred as we annotate.

Below is an example for the article PMC3447931 where only the count is provided, for the patients and for the healthy controls. Note that “diagnosis” implicitly refers to patients, so we can omit the group label here (but it would not be an error to add it).

PMC3447931

See article on PMC

Labelled by Jerome_Dockes in participant_demographics

Patterns of Spontaneous Brain Activity in Amyotrophic Lateral Sclerosis: A Resting-State fMRI Study

40 participants

Healthy participants

20 participants

Patients

Diagnosis: amyotrophic lateral sclerosis

20 patients

full extraction details
count = 40

patients

count = 20, diagnosis = amyotrophic lateral sclerosis

_

count = 20, diagnosis = amyotrophic lateral sclerosis

female

diagnosis = amyotrophic lateral sclerosis

male

diagnosis = amyotrophic lateral sclerosis

healthy

count = 20

_

count = 20

female

male

diagnosis
…reflect spontaneous cerebral neural activity. Previous fMRI studies were focused on the examination of motor-related areas and little is known about the functional changes in the extra-motor areas in amyotrophic lateral sclerosis (ALS) patients. The aim of this study is to investigate functional cerebral abnormalities in ALS patients on a whole brain scale. Twenty ALS patients and twenty age- and sex-matched healthy volunteer…
patients
count
20
…nal changes in the extra-motor areas in amyotrophic lateral sclerosis (ALS) patients. The aim of this study is to investigate functional cerebral abnormalities in ALS patients on a whole brain scale. Twenty ALS patients and twenty age- and sex-matched healthy volunteers were enrolled. Voxel-based analysis was used to characterize the alteration of amplitude of low frequency fluctuation (ALFF). Compared …
healthy
count
20
…-motor areas in amyotrophic lateral sclerosis (ALS) patients. The aim of this study is to investigate functional cerebral abnormalities in ALS patients on a whole brain scale. Twenty ALS patients and twenty age- and sex-matched healthy volunteers were enrolled. Voxel-based analysis was used to characterize the alteration of amplitude of low frequency fluctuation (ALFF). Compared with the controls, the A…

Participant demographics summaries#

The repository contains utilities to extract summaries about the participant groups from an article’s annotations and display them as shown in this page.

scripts/participants_report.py creates a report for all the articles exported from a given annotator and project.

scripts/watch_participants.py serves a live summary of the participant groups in the document we are currently annotating in labelbuddy. From the root of the repository you can run it with:

scripts/watch_participants.py projects/participant_demographics/Your_Name.labelbuddy

(If you call it without specifying a file it will pick the most recently modified .labelbuddy file in the projects/ directory.)

It will print the path to a file that you can open in a web browser and that can help to check annotations are correctly interpreted as you create them. If possible, the report will be automatically opened in the default web browser.

See scripts/participants_report.py --help and scripts/watch_participants.py --help for details.

Some more examples#

Below are a few more examples of annotated documents to help annotators get started.

PMC9407088

See article on PMC

Labelled by Jerome_Dockes in participant_demographics

Custom 3D fMRI Registration Template Construction Method Based on Time-Series Fusion

2226 participants

Healthy participants   abide 1

573 participants

Healthy participants   abide 2

593 participants

Patients   abide 1

Diagnosis: autism spectrum disorder

539 patients

Patients   abide 2

Diagnosis: autism spectrum disorder

521 patients

full extraction details
count = 2226

patients

count = 1060, diagnosis = autism spectrum disorder

abide 1

count = 539, diagnosis = autism spectrum disorder

female

diagnosis = autism spectrum disorder

male

diagnosis = autism spectrum disorder

abide 2

count = 521, diagnosis = autism spectrum disorder

female

diagnosis = autism spectrum disorder

male

diagnosis = autism spectrum disorder

healthy

count = 1166

abide 1

count = 573

female

male

abide 2

count = 593

female

male

diagnosis
… ### 3.1. Data The data used in this article come from the Autism Brain Imaging Data Exchange (ABIDE) project [ ]. This project aims to accelerate the understanding of the deep brain mechanism of autism spectrum disorder (ASD), which integrates the brain structure and functional imaging data from many laboratories around the world. The abide I and abide II datasets were used. The abide I data were collected from 17 c…
patients
abide 1
count
…e and functional imaging data from many laboratories around the world. The abide I and abide II datasets were used. The abide I data were collected from 17 centers, including 1112 subjects, including 539 ASD patients and 573 normal controls; the abide II dataset was collected from 19 centers, including 1114 subjects, including 521 ASD patients and 593 normal controls. To construct a 3D custom fMRI …
healthy
abide 1
count
…ing data from many laboratories around the world. The abide I and abide II datasets were used. The abide I data were collected from 17 centers, including 1112 subjects, including 539 ASD patients and 573 normal controls; the abide II dataset was collected from 19 centers, including 1114 subjects, including 521 ASD patients and 593 normal controls. To construct a 3D custom fMRI template using fMRI t…
patients
abide 2
count
…ata were collected from 17 centers, including 1112 subjects, including 539 ASD patients and 573 normal controls; the abide II dataset was collected from 19 centers, including 1114 subjects, including 521 ASD patients and 593 normal controls. To construct a 3D custom fMRI template using fMRI time-series data, we first need to preprocess the data. The basic idea of fMRI data preprocessing is to elimi…
healthy
abide 2
count
…om 17 centers, including 1112 subjects, including 539 ASD patients and 573 normal controls; the abide II dataset was collected from 19 centers, including 1114 subjects, including 521 ASD patients and 593 normal controls. To construct a 3D custom fMRI template using fMRI time-series data, we first need to preprocess the data. The basic idea of fMRI data preprocessing is to eliminate the timing error…

PMC8785614

See article on PMC

Labelled by Jerome_Dockes in participant_demographics

Frontal interhemispheric structural connectivity, attention, and executive function in children with perinatal stroke

83 participants

Healthy participants

31 participants

Patients   ais

Diagnosis: arterial ischemic stroke

26 patients

Patients   pvi

Diagnosis: periventricular venous infarction

26 patients

full extraction details
count = 83

patients

count = 52

ais

diagnosis = arterial ischemic stroke, count = 26

female

diagnosis = arterial ischemic stroke

male

diagnosis = arterial ischemic stroke

pvi

diagnosis = periventricular venous infarction, count = 26

female

diagnosis = periventricular venous infarction

male

diagnosis = periventricular venous infarction

healthy

count = 31

_

count = 31

female

male

patients
ais
diagnosis
…rics and parent ratings of ADHD symptoms (ADHD‐5 rating scale) and executive functioning (Behavior Rating Inventory of Executive Function (BRIEF)) were explored. Eighty‐three children were recruited ( arterial ischemic stroke [AIS] n  = 26; periventricular venous infarction [PVI] n  = 26; controls n  = 31). WM metrics were altered for stroke groups compared to controls. Along‐tract analyses showed differences in …
patients
ais
count
…s (ADHD‐5 rating scale) and executive functioning (Behavior Rating Inventory of Executive Function (BRIEF)) were explored. Eighty‐three children were recruited (arterial ischemic stroke [AIS] n  =  26 ; periventricular venous infarction [PVI] n  = 26; controls n  = 31). WM metrics were altered for stroke groups compared to controls. Along‐tract analyses showed differences in WM metrics in are…
patients
pvi
diagnosis
…DHD‐5 rating scale) and executive functioning (Behavior Rating Inventory of Executive Function (BRIEF)) were explored. Eighty‐three children were recruited (arterial ischemic stroke [AIS] n  = 26; periventricular venous infarction [PVI] n  = 26; controls n  = 31). WM metrics were altered for stroke groups compared to controls. Along‐tract analyses showed differences in WM metrics in areas approximating the lesion as well…
patients
pvi
count
…ehavior Rating Inventory of Executive Function (BRIEF)) were explored. Eighty‐three children were recruited (arterial ischemic stroke [AIS] n  = 26; periventricular venous infarction [PVI] n  =  26 ; controls n  = 31). WM metrics were altered for stroke groups compared to controls. Along‐tract analyses showed differences in WM metrics in areas approximating the lesion as well as more remote d…
healthy
count
…ory of Executive Function (BRIEF)) were explored. Eighty‐three children were recruited (arterial ischemic stroke [AIS] n  = 26; periventricular venous infarction [PVI] n  = 26; controls n  =  31 ). WM metrics were altered for stroke groups compared to controls. Along‐tract analyses showed differences in WM metrics in areas approximating the lesion as well as more remote differences at midline…

PMC9230060

See article on PMC

Labelled by Jerome_Dockes in participant_demographics

Changes of Brain Structures and Psychological Characteristics in Predatory, Affective Violent and Nonviolent Offenders

40 participants

Healthy participants

20 participants, 20 males

Patients

Diagnosis: offenders

20 patients, 20 males

full extraction details
count = 40

patients

count = 20, diagnosis = offenders

_

count = 20, diagnosis = offenders

male

count = 20, diagnosis = offenders

healthy

count = 20

_

count = 20

male

count = 20
patients
male
count
… 2. Materials and Methods This prospective study was approved by the local institutional review board of Kaohsiung Veterans General Hospital (protocol number: VGHKS93-CT2-09). This study enrolled 20 right-handed male offenders who were further separated into 3 sub-groups by their records of court verdict: six offenders had committed affective violence (VA group), seven offenders had committed pr…
diagnosis
…hods This prospective study was approved by the local institutional review board of Kaohsiung Veterans General Hospital (protocol number: VGHKS93-CT2-09). This study enrolled 20 right-handed male offenders who were further separated into 3 sub-groups by their records of court verdict: six offenders had committed affective violence (VA group), seven offenders had committed predatory violence (VP group),…
healthy
male
count
…mmit violent crime with detailed documentation in the court records. The NV offenders were defined as the subjects who committed non-violent crime based on the documents in court record. In addition, 20 age-matched right-handed male non-criminal healthy controls (HC group) were enrolled for comparisons. All subjects underwent psychological assessments as well as magnetic resonance imaging (MRI) scan…

PMC9108497

See article on PMC

Labelled by Jerome_Dockes in participant_demographics

Feasibility of FreeSurfer Processing for T1-Weighted Brain Images of 5-Year-Olds: Semiautomated Protocol of FinnBrain Neuroimaging Lab

134 participants

Healthy participants

134 participants, 62 females, 72 males

Age range: 5.08 5.22 years

Age mean: 5.3 years

full extraction details
count = 134, age mean = 5.34, age minimum = 5.08, age maximum = 5.22

healthy

count = 134, age mean = 5.34, age minimum = 5.08, age maximum = 5.22

_

count = 134, age mean = 5.34, age minimum = 5.08, age maximum = 5.22

male

count = 72, age minimum = 5.08, age maximum = 5.22

female

count = 62, age minimum = 5.08, age maximum = 5.22
count
… twins, one participant attended twice, and only the latter scan was included). Eight of them did not start the scan, and four were excluded due to excess motion artifact in the T1-image. Thereafter, 134 T1 images (mean age 5.34 years, SD 0.06 years, range 5.08–5.22 years, 72 boys, 62 girls) entered the processing pipelines. presents the demographic data as recommended in our earlier review ( ). A …
age mean
…attended twice, and only the latter scan was included). Eight of them did not start the scan, and four were excluded due to excess motion artifact in the T1-image. Thereafter, 134 T1 images (mean age 5.34 years, SD 0.06 years, range 5.08–5.22 years, 72 boys, 62 girls) entered the processing pipelines. presents the demographic data as recommended in our earlier review ( ). A flowchart depicting the f…
age minimum
…er scan was included). Eight of them did not start the scan, and four were excluded due to excess motion artifact in the T1-image. Thereafter, 134 T1 images (mean age 5.34 years, SD 0.06 years, range 5.08 –5.22 years, 72 boys, 62 girls) entered the processing pipelines. presents the demographic data as recommended in our earlier review ( ). A flowchart depicting the formation of the final sample thro…
age maximum
…an was included). Eight of them did not start the scan, and four were excluded due to excess motion artifact in the T1-image. Thereafter, 134 T1 images (mean age 5.34 years, SD 0.06 years, range 5.08– 5.22 years, 72 boys, 62 girls) entered the processing pipelines. presents the demographic data as recommended in our earlier review ( ). A flowchart depicting the formation of the final sample through t…
male
count
…ded). Eight of them did not start the scan, and four were excluded due to excess motion artifact in the T1-image. Thereafter, 134 T1 images (mean age 5.34 years, SD 0.06 years, range 5.08–5.22 years, 72 boys, 62 girls) entered the processing pipelines. presents the demographic data as recommended in our earlier review ( ). A flowchart depicting the formation of the final sample through the differe…
female
count
…ht of them did not start the scan, and four were excluded due to excess motion artifact in the T1-image. Thereafter, 134 T1 images (mean age 5.34 years, SD 0.06 years, range 5.08–5.22 years, 72 boys, 62 girls) entered the processing pipelines. presents the demographic data as recommended in our earlier review ( ). A flowchart depicting the formation of the final sample through the different exclus…

PMC8828908

See article on PMC

Labelled by Jerome_Dockes in participant_demographics

Default Mode Network Alterations Induced by Childhood Trauma Correlate With Emotional Function and SLC6A4 Expression

216 participants

Healthy participants

216 participants

full extraction details
count = 216

healthy

count = 216

_

count = 216

female

male

count
…gical underpinning of the relationship between the DMN changes, childhood trauma, and potentially psychopathologies. ## Materials and Methods ### Participants and Questionnaires A total of 216 young adults were recruited from the community. Recruitment criteria included: (a) all participants had no history of genetic psychiatric or neurological illness, psychiatric treatment, or drug or al…

PMC8782893

See article on PMC

Labelled by Jerome_Dockes in participant_demographics

An examination of the relationships between attention/deficit hyperactivity disorder symptoms and functional connectivity over time

167 participants

Healthy participants

79 participants

Patients

Diagnosis: attention/deficit hyperactivity disorder

88 patients

full extraction details
count = 167

patients

count = 88, diagnosis = attention/deficit hyperactivity disorder

_

count = 88, diagnosis = attention/deficit hyperactivity disorder

female

diagnosis = attention/deficit hyperactivity disorder

male

diagnosis = attention/deficit hyperactivity disorder

healthy

count = 79

_

count = 79

female

male

diagnosis
…tivity over time # Keywords Attention Developmental disorders # Abstract Previous cross-sectional work has demonstrated resting-state connectivity abnormalities in children and adolescents with attention/deficit hyperactivity disorder (ADHD) relative to typically developing controls. However, it is unclear to what extent these neural abnormalities confer risk for later symptoms of the disorder, or represent the downstream effects …
count
167
…ter-forming threshold of p  ≤ 0.001 and an FWE cluster corrected threshold of p  < 0.05/4 = 0.0125. *<0.05, **<0.001. ## Results ### Sample demographics and descriptive analyses One hundred and sixty-seven children and adolescents had functional connectivity data acquired at a mean interval of 2.56 years (SD = 1.5, range = 0.75–6.84 years) in tandem with ADHD symptom assessments. A total of 88 (52.69%)…
patients
count
…sixty-seven children and adolescents had functional connectivity data acquired at a mean interval of 2.56 years (SD = 1.5, range = 0.75–6.84 years) in tandem with ADHD symptom assessments. A total of 88 (52.69%) subjects met DSM-5 diagnostic criteria for ADHD during at least one time point, defined by the presence of six or more impairing symptoms of inattention, six or more symptoms of hyperactivit…

PMC8752963

See article on PMC

Labelled by Jerome_Dockes in participant_demographics

Cortical correlation structure of aperiodic neuronal population activity

110 participants

Healthy participants

110 participants

full extraction details
count = 110

healthy

count = 110

_

count = 110

female

male

count
110
…rain), spectrally (frequency x frequency), and locally (inspecting correlations between local neighborhoods of each seed pair). Fig 1 ## Methods ### MEG datasets We analyzed data from 112 healthy subjects recorded at the MEG Center Tübingen ( n  = 23) and at Saint Louis University as part of the Human Connectome Project ( n  = 89) ( ). Two subjects were excluded because of wrong d…

PMC8978988

See article on PMC

Labelled by Jerome_Dockes in participant_demographics

Novel compound heterozygous mutations in a GNE myopathy with congenital thrombocytopenia: A case report and literature review

1 participants

Patients

Diagnosis: GNE myopathy with congenital thrombocytopenia

1 patients, 1 males

full extraction details
diagnosis = GNE myopathy with congenital thrombocytopenia, count = 1

patients

count = 1, diagnosis = GNE myopathy with congenital thrombocytopenia

_

count = 1, diagnosis = GNE myopathy with congenital thrombocytopenia

male

count = 1, diagnosis = GNE myopathy with congenital thrombocytopenia
diagnosis
…yopathy with congenital thrombocytopenia: A case report and literature review # Keywords compound gene mutations GNE myopathy heterogeneity sialic acid thrombocytopenia # Abstract We reported a GNE myopathy with congenital thrombocytopenia on a young male patient. He presented with a 3‐year history of lower distal extremity weakness initially affecting his legs. The weakness slowly progressed to lower proximal legs and upper arms last …
male
count
1
…report and literature review # Keywords compound gene mutations GNE myopathy heterogeneity sialic acid thrombocytopenia # Abstract We reported a GNE myopathy with congenital thrombocytopenia on a young male patient. He presented with a 3‐year history of lower distal extremity weakness initially affecting his legs. The weakness slowly progressed to lower proximal legs and upper arms last 6 mon…

PMC8933759

See article on PMC

Labelled by Jerome_Dockes in participant_demographics

Interhemispheric functional connectivity asymmetry is distinctly affected in left and right mesial temporal lobe epilepsy

46 participants

Healthy participants

23 participants

Patients   LMTLE

Diagnosis: Left Mesial Temporal Lobe Epilepsy

12 patients

Patients   RMTLE

Diagnosis: Right Mesial Temporal Lobe Epilepsy

11 patients

full extraction details
count = 46

patients

count = 23, diagnosis = mesial temporal lobe epilepsy

LMTLE

diagnosis = Left Mesial Temporal Lobe Epilepsy, count = 12

female

diagnosis = Left Mesial Temporal Lobe Epilepsy

male

diagnosis = Left Mesial Temporal Lobe Epilepsy

RMTLE

diagnosis = Right Mesial Temporal Lobe Epilepsy, count = 11

female

diagnosis = Right Mesial Temporal Lobe Epilepsy

male

diagnosis = Right Mesial Temporal Lobe Epilepsy

healthy

count = 23

_

count = 23

female

male

diagnosis
…psy resting‐state functional connectivity magnetic resonance imaging # Abstract ## Introduction The differences of functional connectivity (FC) and functional asymmetry between left and right mesial temporal lobe epilepsy with hippocampal sclerosis (LMTLE and RMTLE) have not been completely clarified yet. The purpose of the present study is to investigate the FC changes and the FC asymmetric patterns of MTLE, and to c…
patients
count
…of MTLE would be altered compared with HC, and the FC and functional asymmetries would be distinctly affected in the left and right MTLE. ## METHODS AND MATERIALS ### Subjects We recruited 23 right‐handed adult unilateral MTLE patients diagnosed according to the criteria defined by the Commission on Classification and Terminology of the International League Against Epilepsy (Berg et al., …
patients
LMTLE
diagnosis
Left Mesial Temporal Lobe Epilepsy
…ents diagnosed according to the criteria defined by the Commission on Classification and Terminology of the International League Against Epilepsy (Berg et al., ). The patients were then divided into left MTLE (LMTLE) ( n  = 12) or right MTLE (RMTLE) ( n  = 11) groups based on clinical manifestations, video electroencephalography (v‐EEG), neuroimaging results, and/or positron emission tomography‐comput…
patients
LMTLE
count
… the criteria defined by the Commission on Classification and Terminology of the International League Against Epilepsy (Berg et al., ). The patients were then divided into left MTLE (LMTLE) ( n  =  12 ) or right MTLE (RMTLE) ( n  = 11) groups based on clinical manifestations, video electroencephalography (v‐EEG), neuroimaging results, and/or positron emission tomography‐computed tomography (PET‐C…
patients
RMTLE
diagnosis
Right Mesial Temporal Lobe Epilepsy
…iteria defined by the Commission on Classification and Terminology of the International League Against Epilepsy (Berg et al., ). The patients were then divided into left MTLE (LMTLE) ( n  = 12) or right MTLE (RMTLE) ( n  = 11) groups based on clinical manifestations, video electroencephalography (v‐EEG), neuroimaging results, and/or positron emission tomography‐computed tomography (PET‐CT). To minimize…
patients
RMTLE
count
…sion on Classification and Terminology of the International League Against Epilepsy (Berg et al., ). The patients were then divided into left MTLE (LMTLE) ( n  = 12) or right MTLE (RMTLE) ( n  =  11 ) groups based on clinical manifestations, video electroencephalography (v‐EEG), neuroimaging results, and/or positron emission tomography‐computed tomography (PET‐CT). To minimize heterogeneity among…
healthy
count
…nal intensity on T2FLAIR, and widening of ipsilateral temporal angle) (Malmgren & Thom, ). The age of epilepsy onset (first unprovoked seizure) and epilepsy duration were also recorded. In addition, 23 right‐handed, healthy adults with matched age and gender were recruited as controls. There were no lesions on MRI and no self‐reported central nervous system disorders in any controls. Consistency in…

PMC9205431

See article on PMC

Labelled by Jerome_Dockes in participant_demographics

Inferring excitation-inhibition dynamics using a maximum entropy model unifying brain structure and function

76 participants

Healthy participants   APOE

38 participants, 22 females, 16 males

Healthy participants   NC

38 participants, 22 females, 16 males

full extraction details
count = 76

healthy

count = 76

NC

count = 38

female

count = 22

male

count = 16

APOE

count = 38

female

count = 22

male

count = 16
healthy
count
…on, and emergent behavior. ## MATERIALS AND METHODS ### Participants and MRI Data Acquisition The cohort used in this work has been described in a previous study ( ). Participants ( N = 76 ; all Caucasian) were selected based on APOE genotype from a larger sample of 150 adults aged 40–60 (age = 49.9 ± 6.0 in years; 60 men). The University of Wisconsin–Madison Biotechnology Center conduc…
healthy
NC
count
…irty-eight individuals out of the larger sample were APOE-ε4 carriers (either ε3/ε4 or ε4/ε4). Hence, a subset of noncarriers (ε3/ε3 or e2/ε3) were age- and sex-matched, creating equal groups ( N = 38 , 22 female) of carriers (APOE) and noncarriers (NC). The following exclusion criteria were used: (a) self-reported cognitive or memory complaints; (b) Mini–Mental State Exam (MMSE; ) score ≤ 24; (c)…
healthy
APOE
count
…rty-eight individuals out of the larger sample were APOE-ε4 carriers (either ε3/ε4 or ε4/ε4). Hence, a subset of noncarriers (ε3/ε3 or e2/ε3) were age- and sex-matched, creating equal groups ( N = 38 , 22 female) of carriers (APOE) and noncarriers (NC). The following exclusion criteria were used: (a) self-reported cognitive or memory complaints; (b) Mini–Mental State Exam (MMSE; ) score ≤ 24; (c)…
healthy
NC
female
count
…-eight individuals out of the larger sample were APOE-ε4 carriers (either ε3/ε4 or ε4/ε4). Hence, a subset of noncarriers (ε3/ε3 or e2/ε3) were age- and sex-matched, creating equal groups ( N = 38, 22 female) of carriers (APOE) and noncarriers (NC). The following exclusion criteria were used: (a) self-reported cognitive or memory complaints; (b) Mini–Mental State Exam (MMSE; ) score ≤ 24; (c) Mat…
healthy
APOE
female
count
…eight individuals out of the larger sample were APOE-ε4 carriers (either ε3/ε4 or ε4/ε4). Hence, a subset of noncarriers (ε3/ε3 or e2/ε3) were age- and sex-matched, creating equal groups ( N = 38, 22 female) of carriers (APOE) and noncarriers (NC). The following exclusion criteria were used: (a) self-reported cognitive or memory complaints; (b) Mini–Mental State Exam (MMSE; ) score ≤ 24; (c) Mat…

PMC9461104

See article on PMC

Labelled by Jerome_Dockes in participant_demographics

Clinical, radiological, and genetic variation in pontocerebellar hypoplasia disorder and our clinical experience

6 participants

Patients

Diagnosis: Pontocerebellar hypoplasia

6 patients

full extraction details
diagnosis = Pontocerebellar hypoplasia, count = 6

patients

count = 6, diagnosis = Pontocerebellar hypoplasia

_

count = 6, diagnosis = Pontocerebellar hypoplasia

female

diagnosis = Pontocerebellar hypoplasia

male

diagnosis = Pontocerebellar hypoplasia
diagnosis
…ical, and genetic variation in pontocerebellar hypoplasia disorder and our clinical experience # Keywords Pontocerebellar Hypoplasia Neurodegenerative Disorders Microcephaly Epilepsy # Abstract Pontocerebellar hypoplasia (PCH) constitutes a heterogeneous neurodegenerative/neurodevelopmental disorder of the pons and cerebellum with onset in the prenatal period. Our study aimed to present different clinical and radiolo…
patients
count
6
…der of the pons and cerebellum with onset in the prenatal period. Our study aimed to present different clinical and radiological manifestations of our genetically diagnosed PCH patients. Method:  Six patients were enrolled in this study from September 2018 to March 2021. All the clinical radiological and genetic investigations were done at Cukurova University Medical School. Results: Five ch…

PMC9564100

See article on PMC

Labelled by Jerome_Dockes in participant_demographics

Human cerebellum and corticocerebellar connections involved in emotional memory enhancement

1418 participants

Healthy participants

1418 participants, 872 females, 546 males

Age range: 18 35 years

Age mean: 22.4 years

full extraction details
count = 1418, age mean = 22.39, age minimum = 18, age maximum = 35

healthy

count = 1418, age mean = 22.39, age minimum = 18, age maximum = 35

_

count = 1418, age mean = 22.39, age minimum = 18, age maximum = 35

female

count = 872, age minimum = 18, age maximum = 35

male

count = 546, age minimum = 18, age maximum = 35
count
1418
…ebellum has been found to be involved in fear conditioning, its role in emotional enhancement of episodic memory is less clear. To address this issue, we used a whole-brain functional MRI approach in 1,418 healthy participants. First, we identified clusters significantly activated during enhanced memory encoding of negative and positive emotional pictures. In addition to the well-known emotional memory…
female
count
…g of psychiatric disorders with aberrant emotional circuitry, such as PTSD or autism spectrum disorder. ## Materials and Methods ### Participants. We recruited healthy, young participants ( 872 females, 546 males, mean age = 22.39 y, SD = 3.27). Advertising was done mainly at the University of Basel and in local newspapers. The participants were free of any neurological or psychiatric illne…
male
count
…ric disorders with aberrant emotional circuitry, such as PTSD or autism spectrum disorder. ## Materials and Methods ### Participants. We recruited healthy, young participants (872 females, 546 males, mean age = 22.39 y, SD = 3.27). Advertising was done mainly at the University of Basel and in local newspapers. The participants were free of any neurological or psychiatric illness, did not t…
age mean
…rrant emotional circuitry, such as PTSD or autism spectrum disorder. ## Materials and Methods ### Participants. We recruited healthy, young participants (872 females, 546 males, mean age = 22.39 y, SD = 3.27). Advertising was done mainly at the University of Basel and in local newspapers. The participants were free of any neurological or psychiatric illness, did not take any medication at th…
age range
…al newspapers. The participants were free of any neurological or psychiatric illness, did not take any medication at the time of the experiment (except hormonal contraceptives), and were between ages 18 and 35 y. Physical and mental health was assessed based on standard questionnaires. The experiment was approved by the ethics committee of the Canton of Basel, Switzerland. All participants gave written inf…

PMC9548384

See article on PMC

Labelled by Jerome_Dockes in participant_demographics

Wearing a KN95/FFP2 facemask induces subtle yet significant brain functional connectivity modifications restricted to the salience network

23 participants

Healthy participants

23 participants, 23 males

Age mean: 29.9 years

full extraction details
age mean = 29.9, count = 23

healthy

count = 23, age mean = 29.9

_

count = 23, age mean = 29.9

male

count = 23, age mean = 29.9
male
count
…nity-dwelling cases recruited via advertisements in local media. One case was excluded from further analysis due to the incidental finding of an enlarged ventricular system. The final sample included 23 community-dwelling young men aged 29.9 ± 6.9 years (mean ± standard deviation) recruited via advertisements in local newspapers and social media. The following exclusion criteria were applied: (i) pr…
age mean
…ertisements in local media. One case was excluded from further analysis due to the incidental finding of an enlarged ventricular system. The final sample included 23 community-dwelling young men aged 29.9  ± 6.9 years (mean ± standard deviation) recruited via advertisements in local newspapers and social media. The following exclusion criteria were applied: (i) presence or history of a chronic psychiat…

PMC9308181

See article on PMC

Labelled by Jerome_Dockes in participant_demographics

Renal phenotypes correlate with genotypes in unrelated individuals with tuberous sclerosis complex in China

173 participants

Patients

Diagnosis: tuberous sclerosis complex

173 patients

full extraction details
diagnosis = tuberous sclerosis complex, count = 173

patients

count = 173, diagnosis = tuberous sclerosis complex

_

count = 173, diagnosis = tuberous sclerosis complex

female

diagnosis = tuberous sclerosis complex

male

diagnosis = tuberous sclerosis complex
diagnosis
…notype Renal phenotype TSC1 TSC2 # Abstract ## Purpose To explore the relationship between the genotype and renal phenotype in a Chinese cohort and guide clinical decision-making for treating tuberous sclerosis complex (TSC). ## Materials and methods We reviewed 173 patients with definite TSC at three centers in China from September 2014 to September 2020. All the patients underwent TSC1 and TSC2 gen…
patients
count
…uide clinical therapy with precision for TSC patients, we further explored whether different genotypes affect mTOR inhibitor treatment response. ## Methods ### Study group A cohort of all 173 unrelated patients with a definite diagnosis of TSC who had been treated at Xiangya Hospital Central South University, Peking Union Medical College Hospital and The Affiliated Hospital of Qingdao Uni…

PMC8939409

See article on PMC

Labelled by Jerome_Dockes in participant_demographics

Altered brain network topology related to working memory in internet addiction

47 participants

Healthy participants

23 participants, 13 females, 10 males

Age mean: 21.1 years

Patients

Diagnosis: internet addiction

24 patients, 10 females, 14 males

Age mean: 20.6 years

full extraction details
count = 47, age mean = 20.85

patients

count = 24, age mean = 20.58, diagnosis = internet addiction

_

count = 24, age mean = 20.58, diagnosis = internet addiction

male

count = 14, diagnosis = internet addiction

female

count = 10, diagnosis = internet addiction

healthy

count = 23, age mean = 21.13

_

count = 23, age mean = 21.13

male

count = 10

female

count = 13
diagnosis
Wang, Hongxia and Sun, Yan and Lan, Fan and Liu, Yan J Behav Addict, 2020 # Title Altered brain network topology related to working memory in internet addiction # Keywords internet addiction working memory 2-back eLORETA graph theory # Abstract ## Background and aims The working memory (WM) ability of internet addicts and the topology underlying the WM processing in internet addi…
patients
count
… In this study, we employed a graph theoretical framework to characterize the topological properties of the IA brain network in the source cortical space during WM task. ## Methods A sample of 24 subjects with IA and 23 matched healthy controls (HCs) performed visual 2-back task. Exact Low Resolution Electromagnetic Tomography was adopted to project the pre-processed EEG signals into source s…
healthy
count
…yed a graph theoretical framework to characterize the topological properties of the IA brain network in the source cortical space during WM task. ## Methods A sample of 24 subjects with IA and 23 matched healthy controls (HCs) performed visual 2-back task. Exact Low Resolution Electromagnetic Tomography was adopted to project the pre-processed EEG signals into source space. Subsequently, Lagg…
patients
count
…bic areas related to WM would show different centrality between the two groups; (3) the network properties would be linked to IA severity. ## Materials and methods ### Subjects A sample of 24 IA (14 males and 10 females; mean age = 20.58 ± 2.39 years) and 23 matched HC participants (10 males and 13 females; mean age = 21.13 ± 2.51 years) with normal or corrected-to-normal vision from Liao…
patients
male
count
…as related to WM would show different centrality between the two groups; (3) the network properties would be linked to IA severity. ## Materials and methods ### Subjects A sample of 24 IA ( 14 males and 10 females; mean age = 20.58 ± 2.39 years) and 23 matched HC participants (10 males and 13 females; mean age = 21.13 ± 2.51 years) with normal or corrected-to-normal vision from Liaoning No…
patients
female
count
… WM would show different centrality between the two groups; (3) the network properties would be linked to IA severity. ## Materials and methods ### Subjects A sample of 24 IA (14 males and 10 females; mean age = 20.58 ± 2.39 years) and 23 matched HC participants (10 males and 13 females; mean age = 21.13 ± 2.51 years) with normal or corrected-to-normal vision from Liaoning Normal Universi…
patients
age mean
…t centrality between the two groups; (3) the network properties would be linked to IA severity. ## Materials and methods ### Subjects A sample of 24 IA (14 males and 10 females; mean age = 20.58 ± 2.39 years) and 23 matched HC participants (10 males and 13 females; mean age = 21.13 ± 2.51 years) with normal or corrected-to-normal vision from Liaoning Normal University were recruited in this …
healthy
count
… two groups; (3) the network properties would be linked to IA severity. ## Materials and methods ### Subjects A sample of 24 IA (14 males and 10 females; mean age = 20.58 ± 2.39 years) and 23 matched HC participants (10 males and 13 females; mean age = 21.13 ± 2.51 years) with normal or corrected-to-normal vision from Liaoning Normal University were recruited in this study. All were right…
healthy
male
count
… properties would be linked to IA severity. ## Materials and methods ### Subjects A sample of 24 IA (14 males and 10 females; mean age = 20.58 ± 2.39 years) and 23 matched HC participants ( 10 males and 13 females; mean age = 21.13 ± 2.51 years) with normal or corrected-to-normal vision from Liaoning Normal University were recruited in this study. All were right handed as defined by the Ed…
healthy
female
count
…ould be linked to IA severity. ## Materials and methods ### Subjects A sample of 24 IA (14 males and 10 females; mean age = 20.58 ± 2.39 years) and 23 matched HC participants (10 males and 13 females; mean age = 21.13 ± 2.51 years) with normal or corrected-to-normal vision from Liaoning Normal University were recruited in this study. All were right handed as defined by the Edinburgh Hande…
healthy
age mean
…verity. ## Materials and methods ### Subjects A sample of 24 IA (14 males and 10 females; mean age = 20.58 ± 2.39 years) and 23 matched HC participants (10 males and 13 females; mean age = 21.13 ± 2.51 years) with normal or corrected-to-normal vision from Liaoning Normal University were recruited in this study. All were right handed as defined by the Edinburgh Handedness Inventory ( ). Parti…